The best time to post on Facebook in 2026, from 987 posts

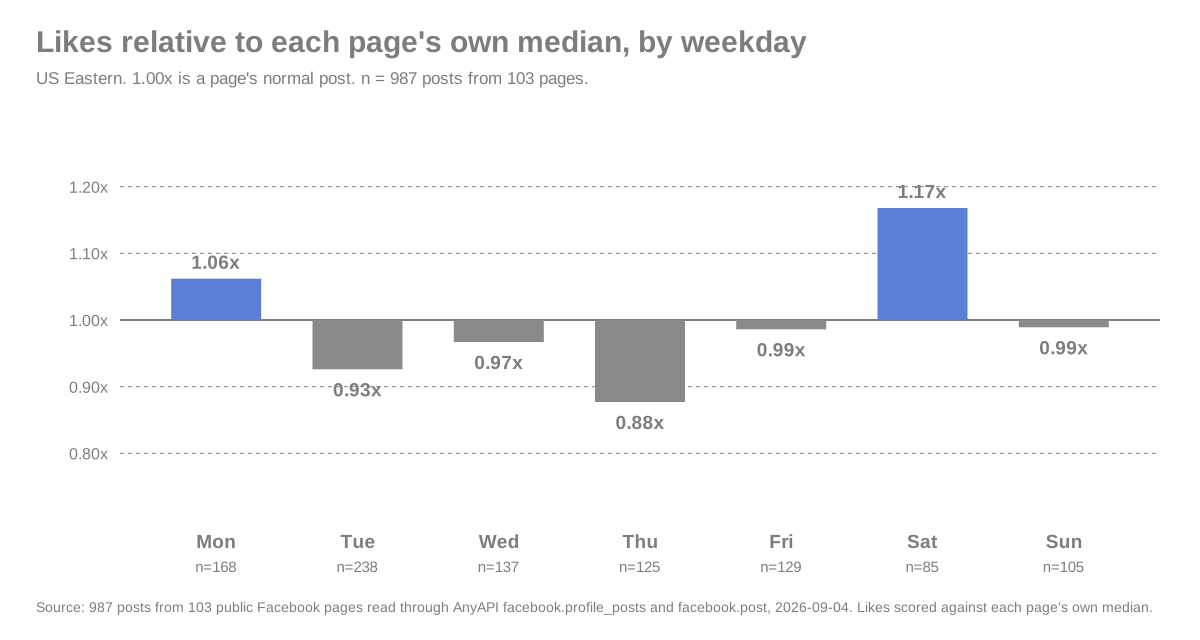
- Saturday is the best day to post on Facebook in this sample, and Thursday the worst. Saturday posts ran about a fifth above every other day against their own page's normal likes. Thursday posts ran about 12% below normal.
- Between 6am and 5pm the hour barely matters. Every daytime hour landed within a few points of normal. The one slot that hurt was 7pm to 9pm, about 17% below the working day.
- Pages post where the data says it matters least. Nearly half of all posts went out between 8am and 1pm, and fewer than one in five landed on a weekend.
- Page size flips the weekend result. Pages under 1k followers gained about a quarter on weekends. The nine pages over 1M followers did worse on weekends, which is what the TikTok study found for large accounts too.
Built on AnyAPI
448 scraping and data APIs behind one key.
Every endpoint in this post is one call away. Pay per request in USD from a prepaid wallet, with automatic failover when a provider breaks. No subscription, no card to start.
Get ~160 free requests$0.10 of credit on signup.The best time to post on Facebook, going by 987 posts from 103 public pages, is Saturday, at any hour between mid-morning and late afternoon in your audience's time zone. That's the whole recommendation, and it's a modest one. The best day ran about a fifth above a page's usual likes, and the working-day hours are flat enough that you should pick whichever one fits your workflow.
I pulled the posts through two Facebook endpoints on AnyAPI, read the like count on each one, and divided it by the page's own median likes, so a national brand and a neighbourhood bakery count the same. Most of the sample is the bakery: the typical page's typical post got about ten likes. If you've read the big studies, you've seen Wednesday, Thursday at 9am, weekdays 9am to 3pm, and Saturday each crowned as the answer. Rank raw engagement across pages and whichever hour the biggest pages favour wins by default. Score each post against its own page first and most of that drama goes away.
At a glance
| Question | What the data says |
|---|---|
| Best day | Saturday, 1.17x a page's normal likes, then Monday at 1.06x |
| Worst day | Thursday at 0.88x, with Tuesday (0.93x) and Wednesday (0.97x) close behind |
| Best hour | Nothing stands out between 6am and 5pm ET; every smoothed hour sits between 0.95x and 1.03x |
| Worst hour | 8pm ET at 0.87x, with 7pm and 9pm on either side of it |
| How big is the gap? | Saturday vs every other day 1.21x (interval 1.02 to 1.44); evening vs working day 0.83x (0.70 to 0.98) |
| Does page size change it? | Yes. Under 1k followers, weekends ran 1.27x weekdays. Over 1M, 0.78x |
| When do pages actually post? | 46% of posts between 8am and 1pm ET, 19% on the weekend |
Saturday wins and Thursday loses, by about a fifth each way
Saturday posts ran about 17% above their page's normal likes, and Thursday about 12% below. Set those against each other and a Saturday post did 1.33 times a Thursday one, with a 95% interval from 1.07 to 1.72. Compare Saturday against every other day and the ratio is 1.21, interval 1.02 to 1.44. Both clear zero. Neither is large.
Monday is the second-best day at 1.06x, which makes the pattern an odd one: the two days on either side of Sunday do best, and the midweek stretch from Tuesday to Thursday does worst. Pool the best three days (Monday, Saturday, Sunday) against the worst three (Tuesday, Wednesday, Thursday) and the gap is 1.15, interval 1.04 to 1.27.
Share of posts that beat their own page's median, by day:
- Monday: 46%, from 168 posts
- Tuesday: 43%, from 238 posts
- Wednesday: 45%, from 137 posts
- Thursday: 40%, from 125 posts
- Friday: 44%, from 129 posts
- Saturday: 49%, from 85 posts
- Sunday: 45%, from 105 posts
Saturday is the only day where nearly half the posts beat their page's baseline, and Thursday the only day where it dropped to four in ten. The rest sit within a few points of each other.
What would make this wrong: Saturday holds 85 posts, the smallest day in the sample, and the pooled weekend result (Saturday and Sunday together against the working week) came in at 1.11 with an interval from 0.98 to 1.25, so it doesn't clear zero on its own. Treat Saturday as the day to try first for a small page, and measure it on your own posts before you move the whole calendar.
The hour barely matters, except in the evening
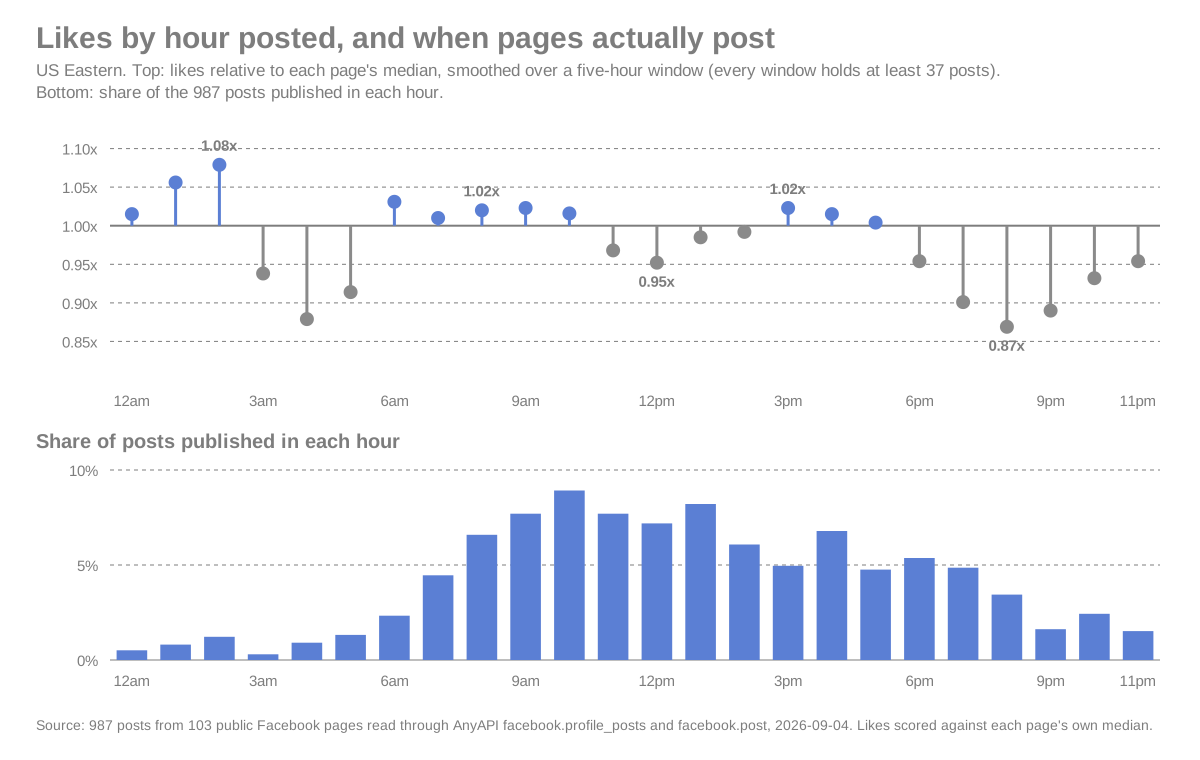
From 6am to 5pm the hour changes almost nothing. Smoothed over a five-hour window, every hour from 6am to 5pm ET sits between 0.95x and 1.03x. Morning posts against midday posts came in at 1.02, with an interval from 0.90 to 1.15. There is no 9am peak here and no lunchtime one.
The evening is where the curve drops. Posts published between 7pm and 9pm ran about 17% below the working day, a ratio of 0.83 with an interval from 0.70 to 0.98. The low point is 8pm at 0.87x. The overnight hours bounce around above and below normal, but no window from midnight to 5am holds more than 92 posts, so I wouldn't read the 2am "peak" as anything.
The part I'd act on is when pages actually post. Pages put 46% of their posts between 8am and 1pm ET and only 19% on the weekend. The busiest hour of the day is 10am, with about 9% of all posts. The evening the data says to avoid already gets few posts, and the weekend the data says to use gets the fewest of all. If you run a scheduler, the default that costs nothing is to move a weekday-morning post to Saturday morning and leave the hour alone.
The weekend lift belongs to small pages
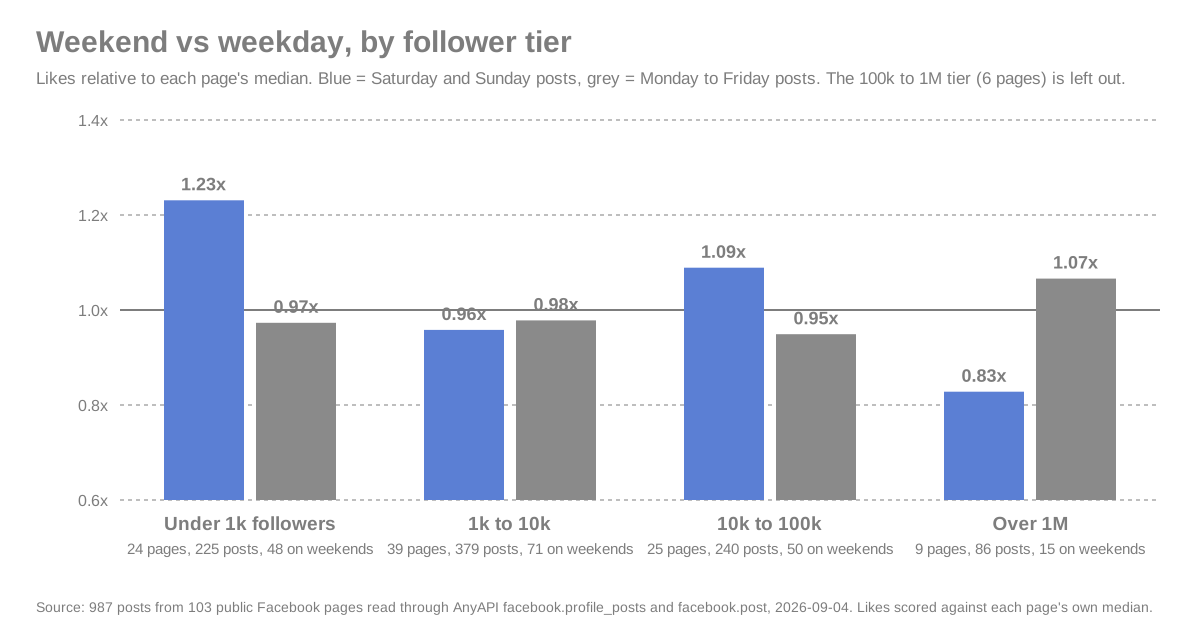
The weekend lift belongs to pages under 1k followers, and pages over 1M reversed it. Cut the weekend result by follower tier:
- Under 1k followers: weekends ran 1.27x weekdays, interval 1.03 to 1.52, from 24 pages
- 1k to 10k: 0.98x, interval 0.79 to 1.22, from 39 pages. Flat
- 10k to 100k: 1.15x, interval 0.92 to 1.42, from 25 pages. Leans the same way, doesn't clear zero
- Over 1M: 0.78x, interval 0.40 to 1.36, from 9 pages and 15 weekend posts. Leans the other way, wide
The 100k to 1M tier is six pages and six weekend posts, too few to plot. The smallest pages are the only tier where the weekend result clears zero, and they're also the pages whose posts get a few dozen likes from people who know the owner. A neighbourhood gym's followers are on Facebook on Saturday morning. A national newsroom's followers are on the news.
That's the same shape the TikTok study found, where a Saturday dip concentrated in accounts over 500k. The largest pages here lean the same direction, on a sample too small to call it. And the very largest pages aren't in the sample at all, for a reason that says something about them: BBC News, CNN, ABC News, Sky News, CBS News, and Reuters each post more than twenty times a day, so in the 60 most recent posts I listed for each of them, none was yet three days old. A study that waits for likes to settle can't score a page that never stops posting.
How this compares to what is already published
The studies you've probably already read each name a window, and they don't agree:
- Sprout Social, from nearly 2 billion engagements across roughly 307,000 profiles, names Tuesdays and Wednesdays from noon to 8pm local time, and calls the weekend the worst time to post, with no peak at all on Saturday.
- Buffer, from 14 million posts, names Thursday at 9am as the single best time and Wednesday as the best day. Saturday is its worst day.
- SocialPilot, from more than 50,000 accounts and 700,000 posts, says weekdays 9am to 3pm, with Sunday the worst day.
- Adobe Express, from 40,138 posts by the top 100 creators on Social Blade, finds Saturday the standout day, with 4am and 8pm Saturday posts earning the most engagement.
Where this study agrees with them: the effect is modest everywhere once you look past the headline hour, and Wednesday, which Buffer names its best day, came second here when posts are scored by comments instead of likes. Where it disagrees: Saturday is the worst day for Sprout and Buffer and the best day here and for Adobe. That split lines up with who was measured. Adobe's sample is 100 large creator pages; mine is mostly small local pages; Sprout's and Buffer's span every kind of account, ranked by engagement volume, which the largest pages dominate.
None of the four prints a confidence interval, and only Buffer says how it normalises. The people asking the question have noticed. The top thread in a Reddit search for the phrase is titled "Best Time to Post is a myth", and a 24-comment thread asks whether posting at the most active time is worth anything at all. In this sample it's worth about a fifth on the best day and nothing across the working-day hours.
How I measured it
The whole crawl ran through three Facebook endpoints on AnyAPI and cost $6.31 in API calls.
- Find pages by category and city. Eighteen searches through
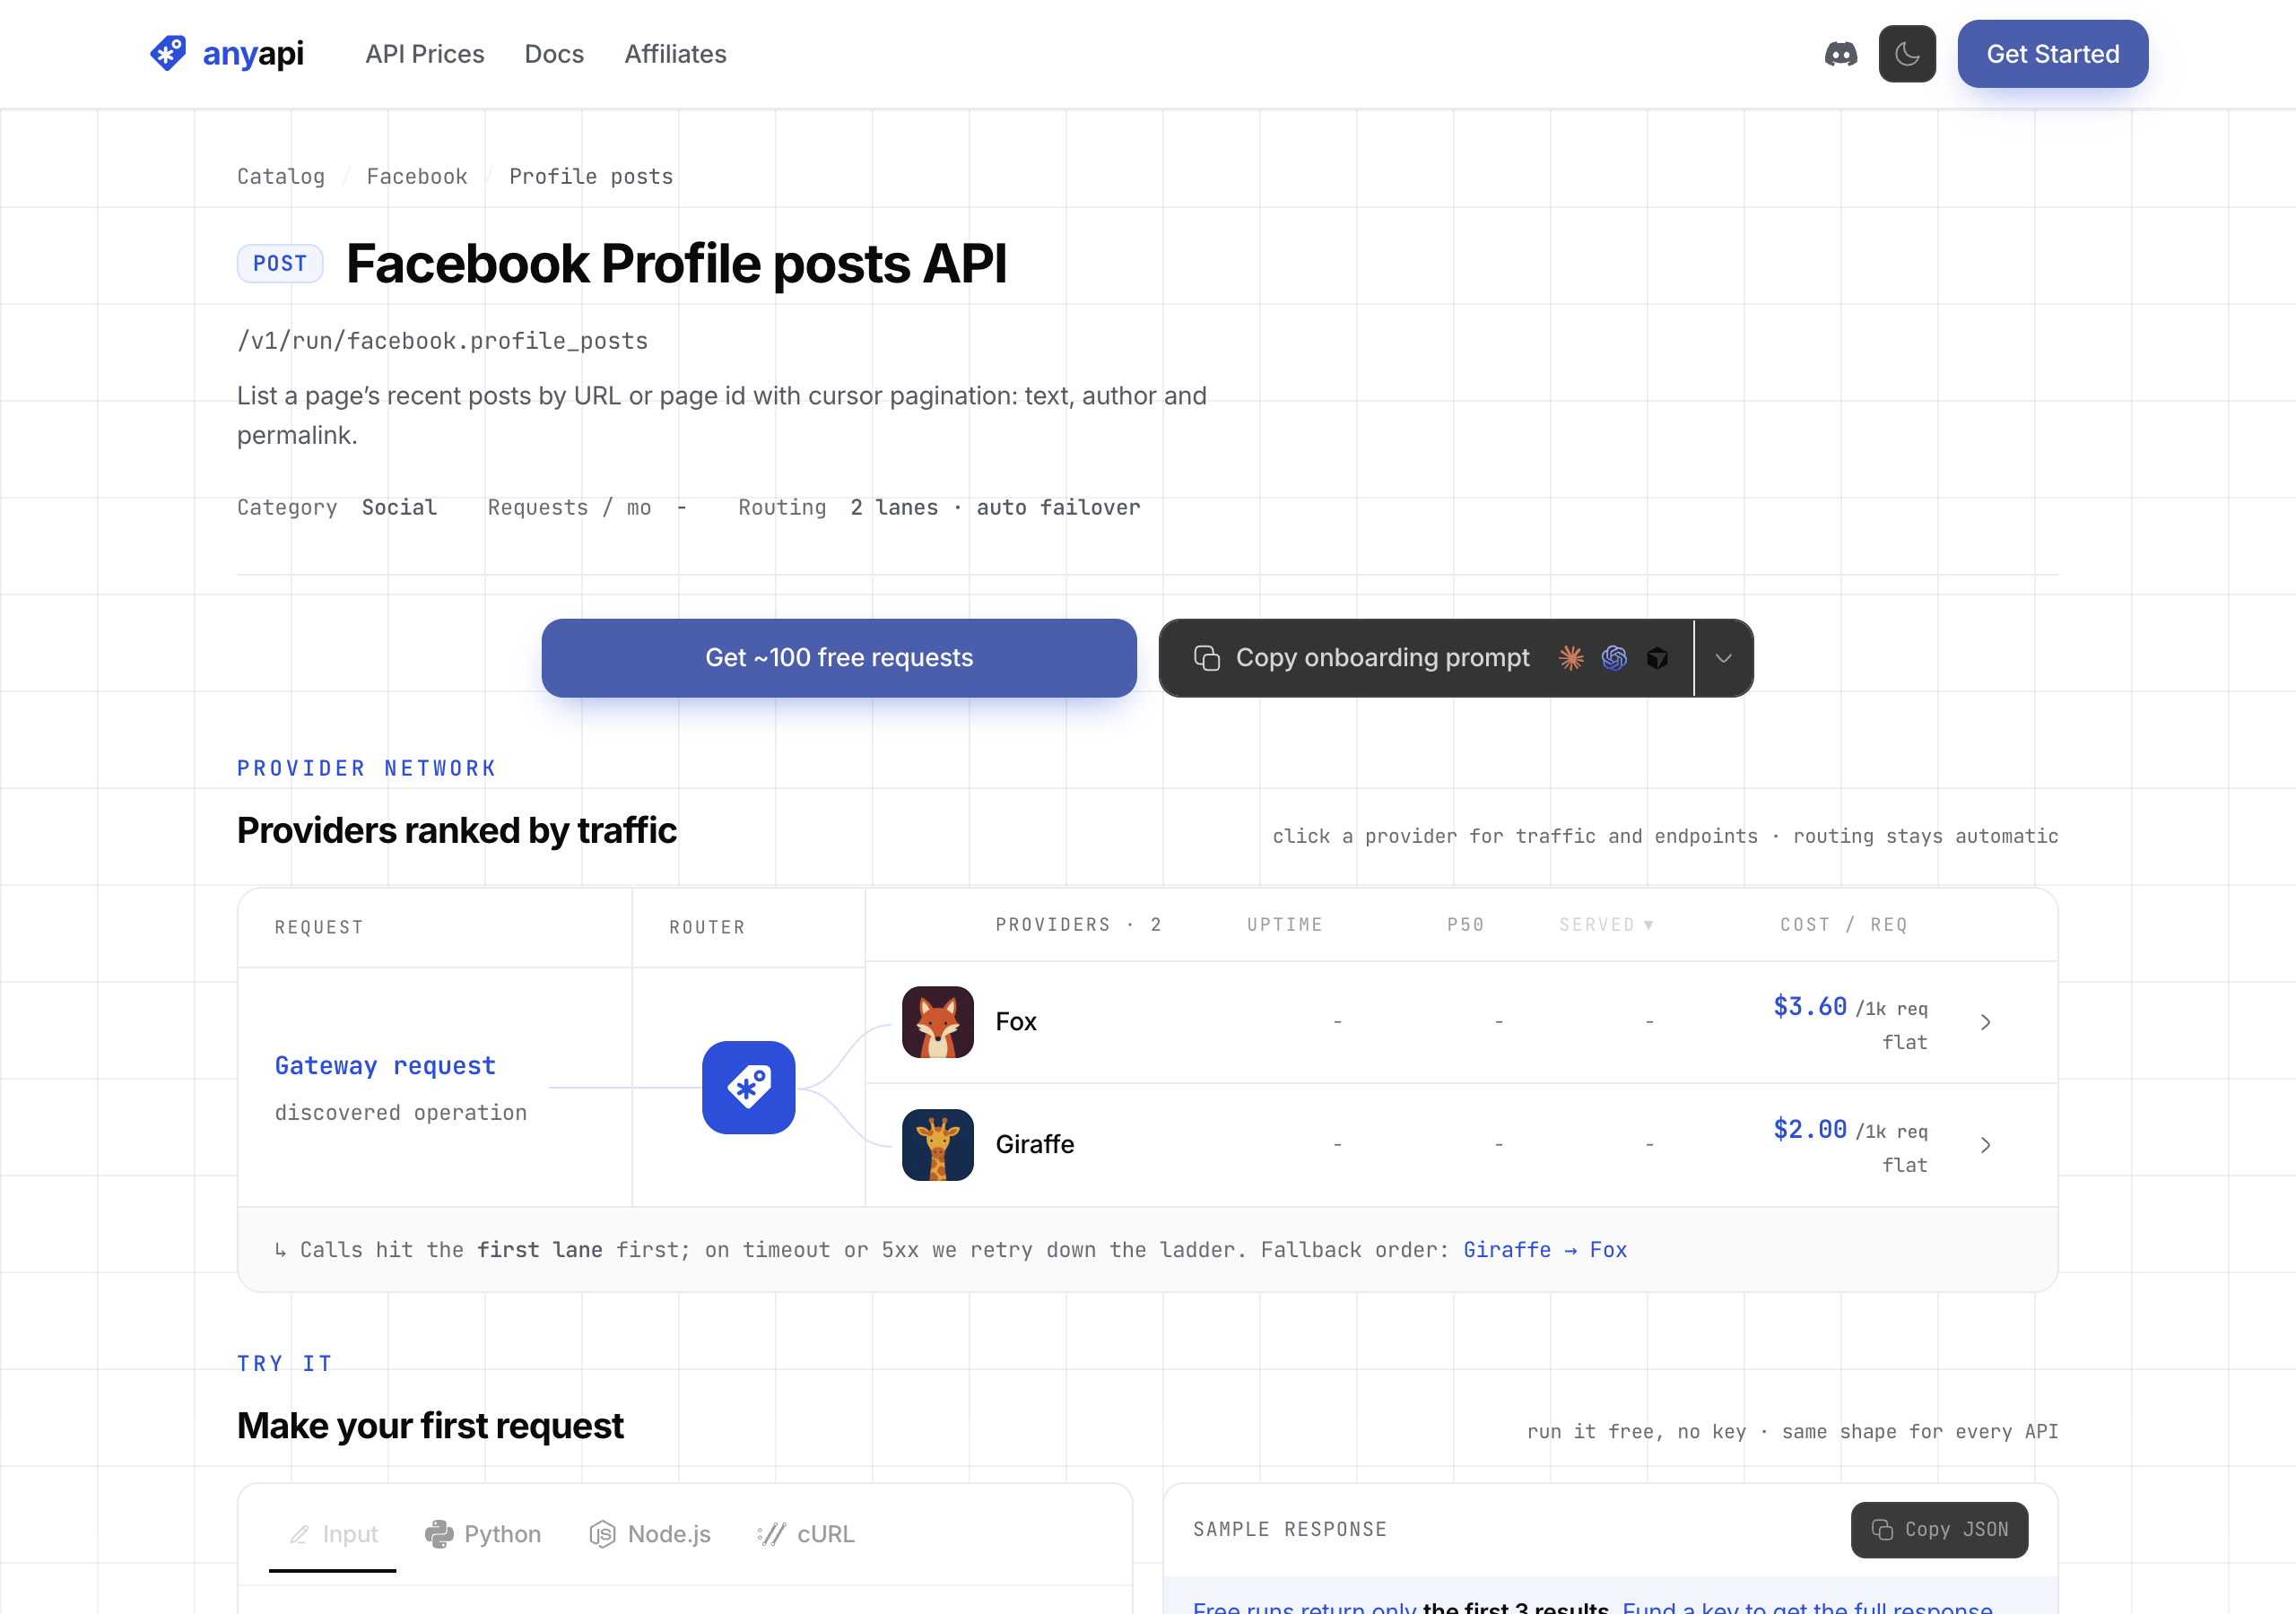
facebook.search_pages, at ten results each: fourteen category queries scoped to a US Eastern city (restaurant in New York, gym in Atlanta, church in Charlotte, real estate agent in Miami, bakery in Boston, and so on through animal shelters, bookstores, dentists, and local news) plus four national queries for news, sports teams, magazines, and podcasts. That returned 175 distinct pages with a follower count and a category each. The searches were the expensive part, at $0.123 a call. - List each page's recent posts.
facebook.profile_postsreturns three posts per call with a timestamp, a permalink, and a cursor for the next three. I followed the cursor until a page had ten posts at least 72 hours old, or six calls were spent. Pages that never reached a three-day-old post in six calls got up to twenty. - Read the likes. The list call carries no engagement, so each mature post went through
facebook.post, which returns likes, comments, shares, and views. The list call bills $0.0012 a request and the read $0.0012. - Apply the cutoffs. Posts had to be published between 2026-03-01 and three days before the read. Pages needed five usable posts. Of the 175 pages, 31 had posted nothing since March, 25 had fewer than five usable posts, 15 posted so often that none of their 60 listed posts was three days old, and one returned nothing. Thirty-two post reads came back not found and were dropped. That left 103 pages and 987 posts, published between 2026-03-02 and 2026-09-02, across 48 page categories.
- Score each post against its own page. Divide each post's likes plus one by the page's median likes plus one, and cap the result at 6x so one viral post counts once. Thirty-four posts hit the cap, and 106 posts had zero likes, which the plus-one keeps in the sample.
- Bucket and average. Convert timestamps to US Eastern, group by weekday and by hour, and take the geometric mean of the scores in each bucket. Hourly buckets are smoothed over a five-hour window. Every interval in this post comes from resampling pages, not posts, 1,000 times.
Here's what one post read returned on 2026-09-27, for a NASA reel:
curl -sS -X POST https://api.getanyapi.com/v1/run/facebook.post \
  -H "Authorization: Bearer $ANYAPI_API_KEY" \
  -H 'Content-Type: application/json' \
-d '{"url":"https://www.facebook.com/reel/1762614364778936/"}'{"output":{"found":true,"data":{"comments":79,"id":"1618497506312286","likes":3317,"shares":477,"views":245957}},"costUsd":0.0012}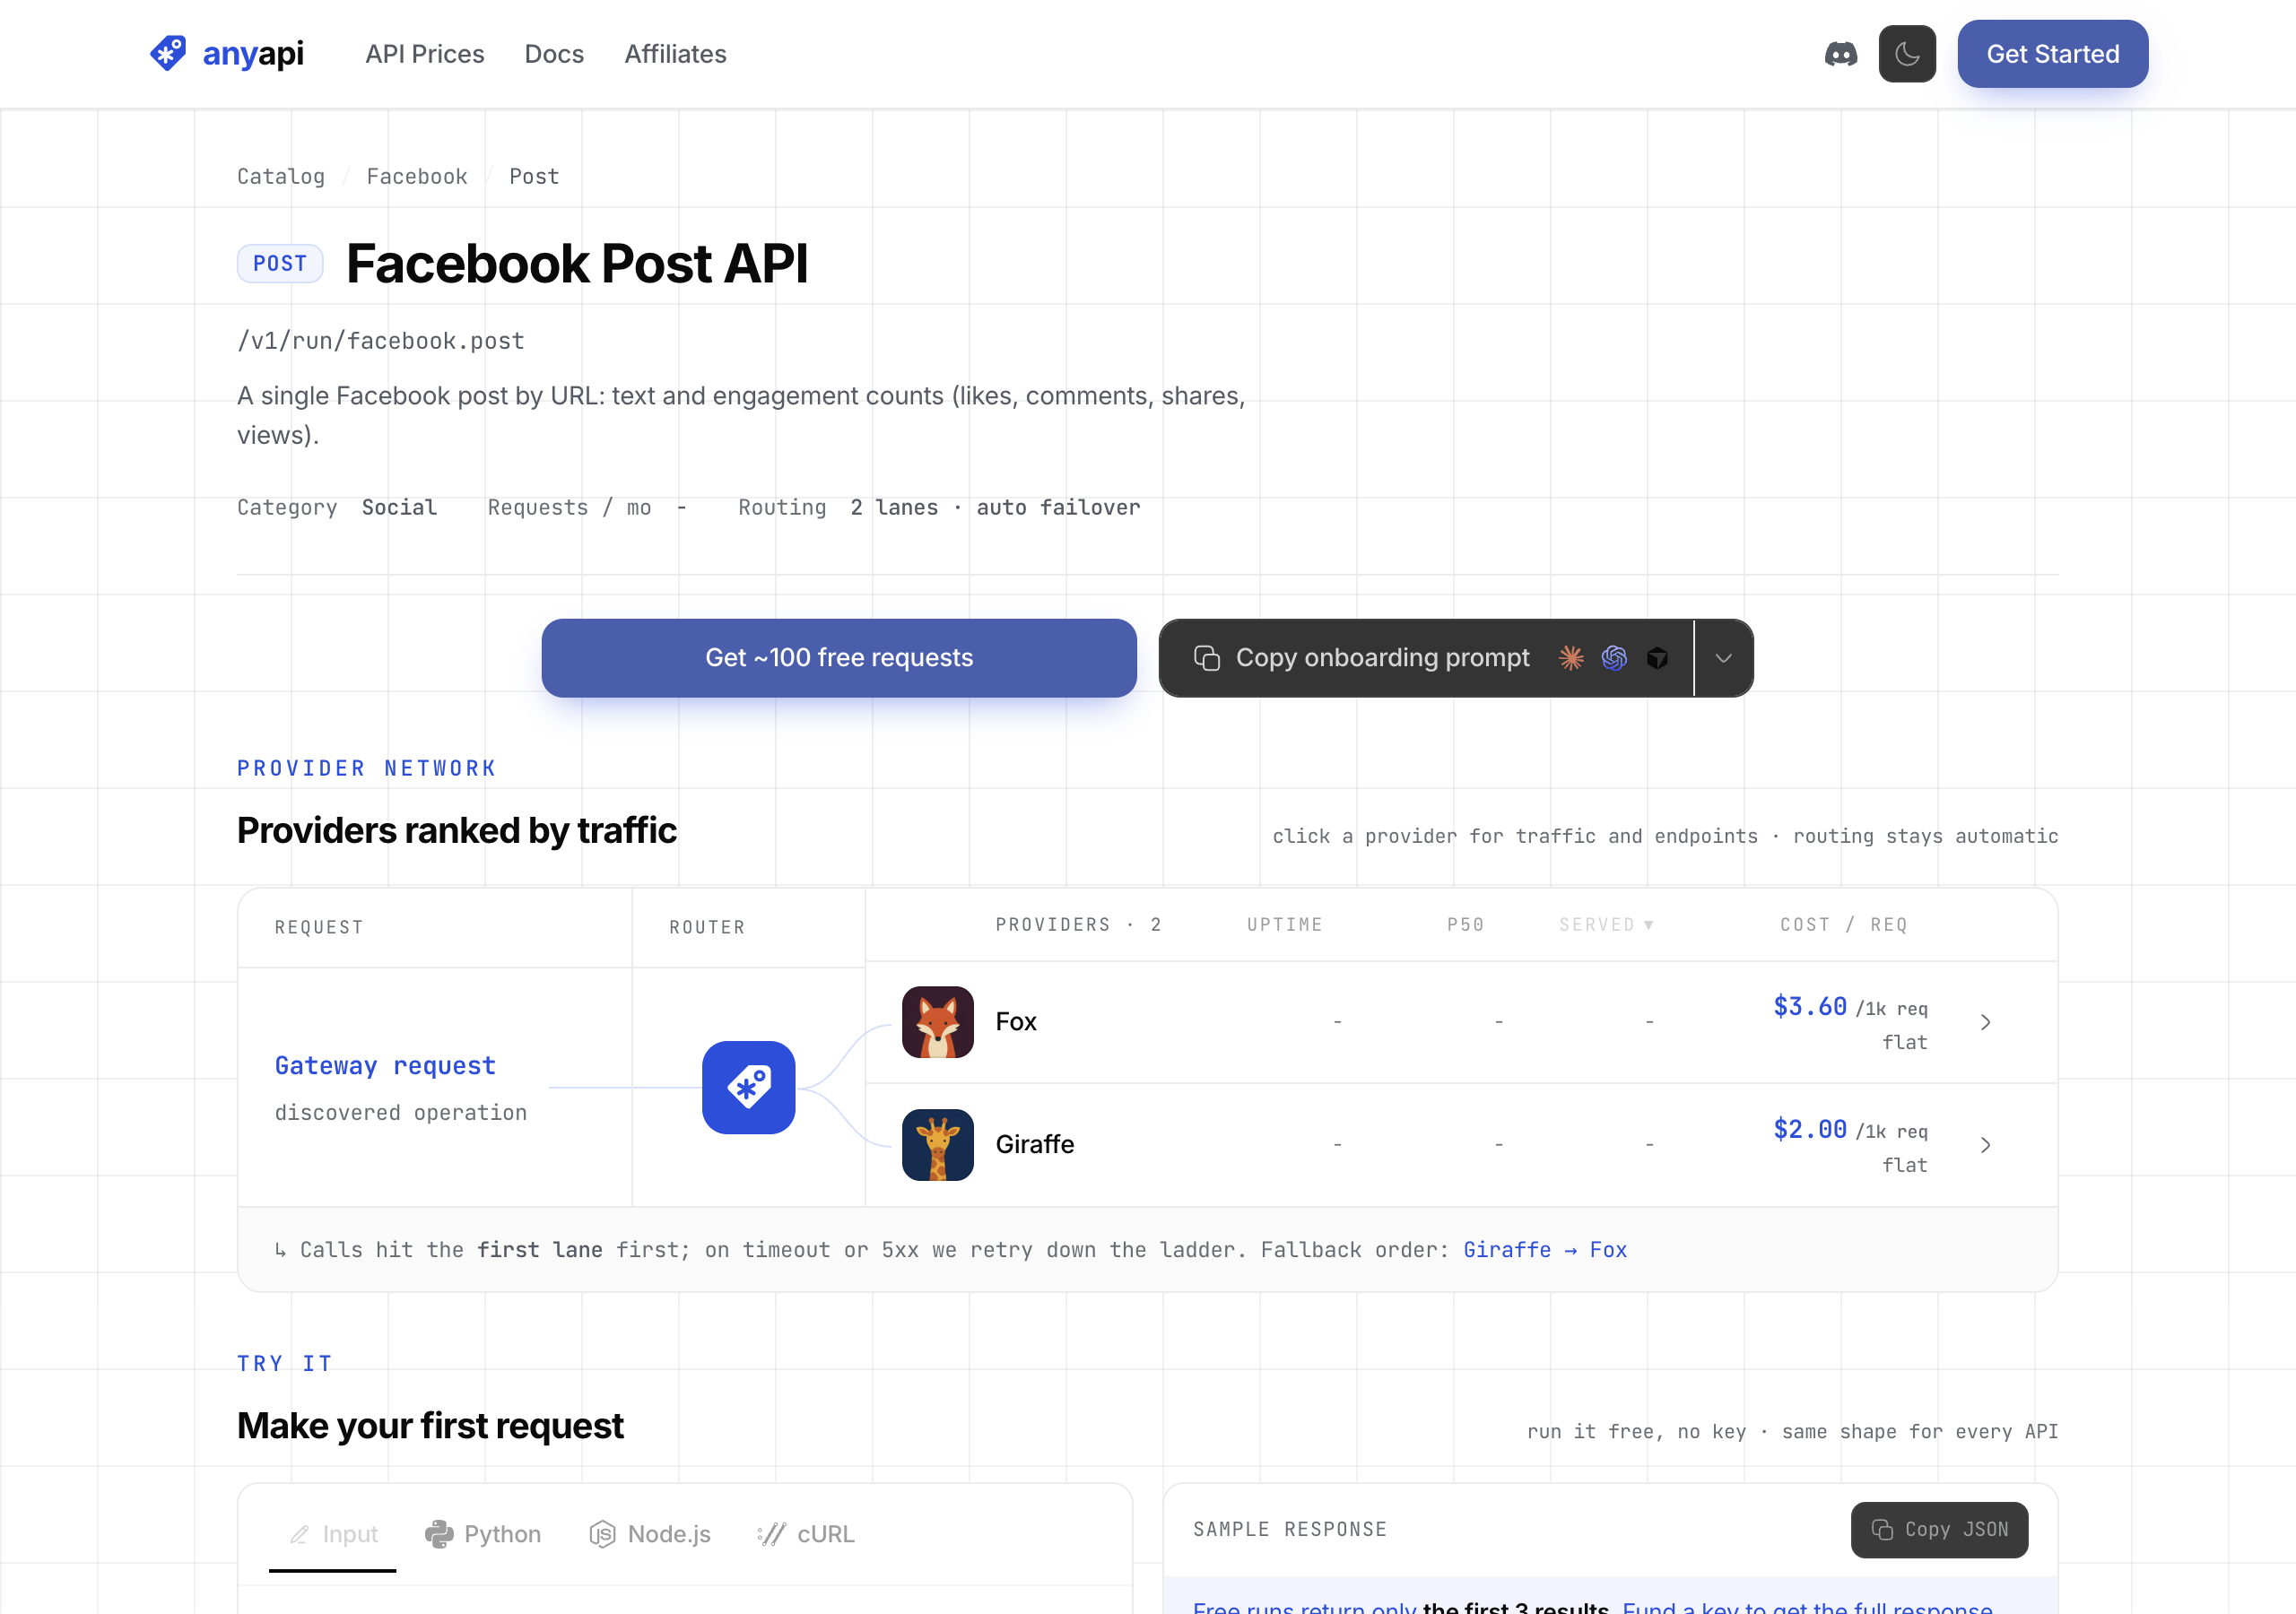
The sample skews small on purpose: 24 pages under 1k followers, 39 between 1k and 10k, 25 between 10k and 100k, 6 between 100k and 1M, and 9 over 1M. The median page had ten posts spanning about three weeks.
The limits of this data
- Likes only. The headline result is a likes result. Score comments instead and Sunday and Wednesday come out on top, with Tuesday at the bottom, a different order. Nothing here speaks to reach, shares, saves, or follower growth.
- US Eastern for everyone. Most pages were found through Eastern-city searches, but the location filter is a free-text hint. A search for animal shelters in Cleveland returned shelters in Cleveland, Alabama; Cleveland, Mississippi; and Cleveland, Tennessee alongside the Ohio ones. The four national queries have no time zone at all.
- Small pages, small counts. The typical page's typical post had about ten likes, so one extra share from a regular moves a post a long way. The cap and the plus-one soften that, and they don't remove it.
- A convenience sample. Pages came from 18 category searches. A different set of categories, or a set that reached the pages that post twenty times a day, could shift a result this small.
- Narrow per-page windows. The median page's posts span about three weeks, and the busiest pages' posts span a few days, so a single page rarely covers every weekday. The weekday result rests on the spread across pages.
- Thin cells at the edges. The raw 8am cell was 1.25x on 65 posts while 7am and 9am both sat below normal, which is why the hourly chart is smoothed. The overnight hours hold under 100 posts per window.
- Observational. A page that saves its best photo for Saturday morning will make Saturday morning look good. Photo, video, and text-only posts scored the same (0.99x, 0.98x, 0.96x), which rules out one confound and none of the others.
- Small effects, some wide intervals. Saturday against the rest clears zero. The pooled weekend doesn't. The tier cuts are 24 to 39 pages each.
Post on a Saturday if you can, avoid 7pm to 9pm, and don't expect either move to change a post's likes by more than about a fifth.
What to do with it
- Default a small page's scheduler to Saturday, then Monday. Those were the two days above normal. Thursday was the day below it.
- Pick the hour by convenience. Anything from 6am to 5pm in your audience's time zone scored the same. Skip 7pm to 9pm.
- Don't copy the weekend rule onto a page over 1M followers. In this sample those pages did worse on weekends, and the TikTok study saw the same for large accounts.
- Measure your own page once it has thirty posts. Pull your recent posts with
facebook.profile_posts, paging past the newest three so you aren't scoring posts that are still collecting likes. Read each one withfacebook.post. Divide each post's likes by your median likes, group by weekday and hour in your audience's time zone, and ignore any group with fewer than about ten posts. That's about forty calls for one page: eleven list calls for $0.0132 and thirty reads for $0.036. - Give a new slot a few weeks before you trust it, then measure again.
Frequently asked questions
What is the best time to post on Facebook?
In this sample, Saturday, at any hour between mid-morning and late afternoon in your audience's time zone. Saturday posts got about a fifth more likes than the same pages' posts on other days, and the daytime hours scored within a few points of each other.
What is the worst time to post on Facebook?
Thursday, and 7pm to 9pm on any day. Thursday posts ran about 12% below a page's normal likes, and posts published between 7pm and 9pm ran about 17% below posts from the working day.
Does posting time matter on Facebook?
A little, and less than the guides suggest. The best and worst day are about a third apart after scoring every post against its own page, and the hours from 6am to 5pm are flat. Timing is a nudge for your default schedule. It isn't worth holding a good post for.
Why do other studies name a different best time?
Different samples, metrics, and time-zone handling, and most rank raw engagement, which lets the biggest pages decide the answer. Sprout Social and Buffer, whose samples span every size of account, call Saturday the worst day. Adobe's sample of 100 large creator pages and this sample of mostly small local pages both call it the best.
The Instagram version of this study and the TikTok version use the same method, and the Facebook endpoints are what you'd use to rerun it on your own page.
Use data responsibly and follow AnyAPI's Acceptable Use Policy.